Generic selectors
Exact matches only
Search in title
Search in content
Post Type Selectors

Google Trends: Interest in Oil Reaches an All-Time High

The current oil crisis might be the biggest one seen this century. Google Trends shows relative search interest for “oil” at an all time high. This peak far exceeds the levels seen during the 2020 COVID crisis and in 2022 when Russia invaded Ukraine.

S&P 500: VIX Falls Below 25 After Staying Above It for At Least 8 Days

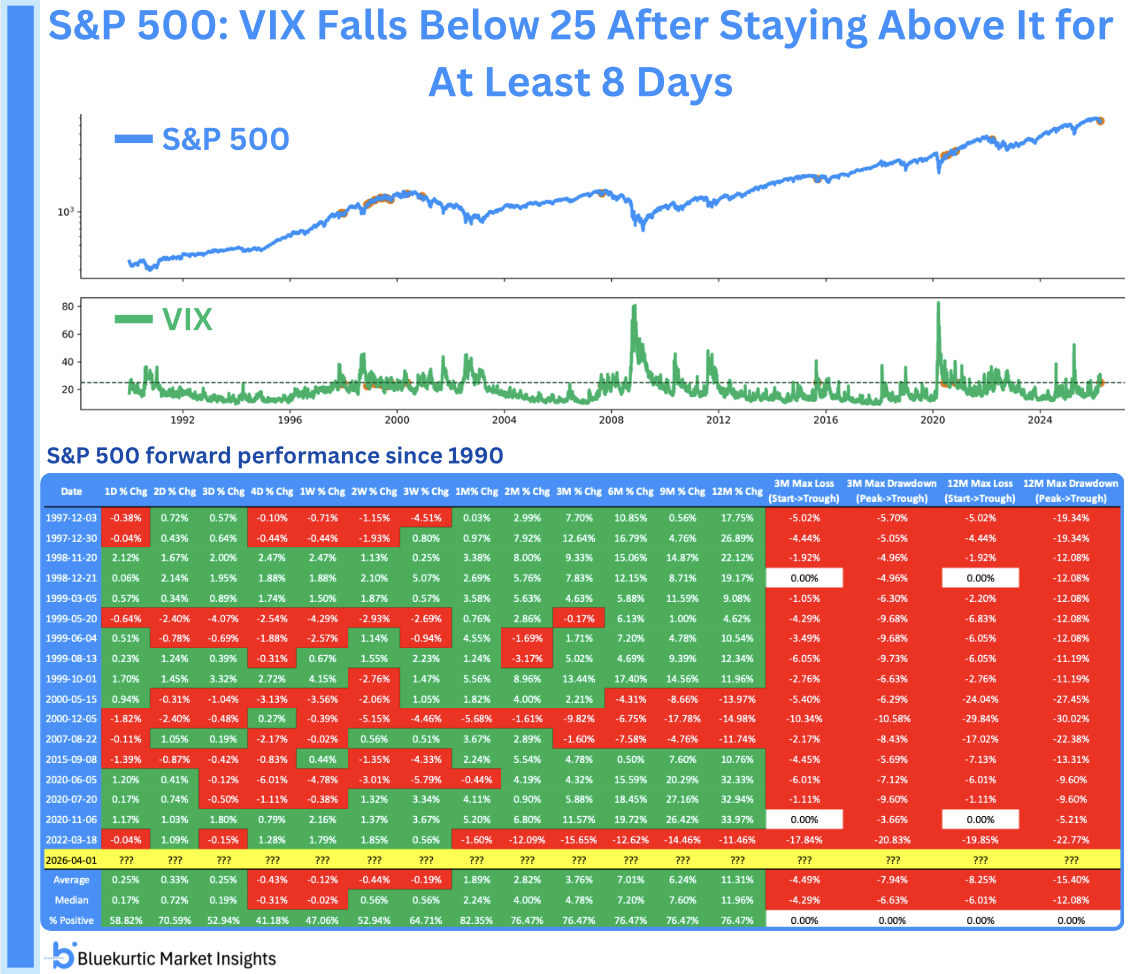
$VIX just closed below 25 after staying above that level for 8 straight days. This level still signals elevated volatility and near term swings in $SPX can remain choppy. But historically, 1 month later, $SPX was higher 14 out of 17 cases, with a median gain of 2.2%.

S&P 500 & Crude Oil: 2022 vs. 2026

Oil surged over 10% in a single day but the S&P 500 still closed higher. We saw a similar setup in 2022. $SPX initially rose alongside crude, but eventually rolled over and made new lows. If tensions persist, the risk of a similar path cannot be ruled out.

Two-panel chart titled “S&P 500: Record Highs, Record Dispersion.” Top panel (green) shows S&P 500 % distance from all-time high, staying near 0% (within a few percent) for long stretches. Bottom panel (red) shows % of S&P 500 constituents in a >20% drawdown, with a dashed reference line near 45% and the series hovering around/above that level. Timeline runs roughly 2006–2026. “© Bluekurtic Market Insights” logo at bottom.

Record Highs, Record Dispersion

Bull market since 2023 is unusual. Over 45% of S&P 500 stocks are in a technical bear market (20% below ATH), yet SPY sits within 3% of its own ATH. Breadth never fully reclaimed the 2021 peak, when fewer than 25% of stocks were in bear markets. Dispersion remains extreme.